pyds.numerical.sodshock
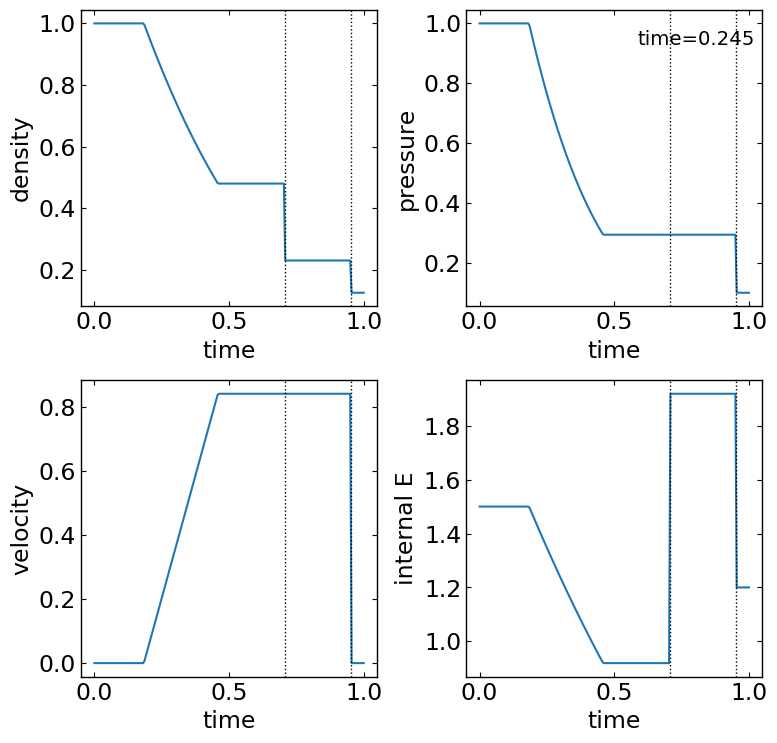
Calculate the analytical values for the sod shocktube problem in adiabatic equation of states
[1]:
from pyds.numerical import sodshock

sod = sodshock(d=[1.,0.125], p=[1.,0.1], v=[0.,0.], gamma=1.66667 \
            ,time=0.245, resol=200, xscale=[0.,1.])
[2]:
import matplotlib.pyplot as plt
import numpy as np
from pyds.tools import axpos

%matplotlib inline

# initialize the configuration of multiple plots
axset = axpos(22,pltx0=[30,10],plty0=[20,10],pltxs=100,pltys=100,pltxw=30.,pltyw=25.)

fig = plt.figure(figsize=(8,8.*axset.winys/axset.winxs))

# density plot
ax1 = fig.add_subplot(221)
ax1.plot(sod.x,sod.d)
ax1.axvline(x=sod.xcd, linestyle=':', linewidth=1, color='k')
ax1.axvline(x=sod.xsh, linestyle=':', linewidth=1, color='k')
ax1.set_xlabel('time')
ax1.set_ylabel('density')

# pressure plot
ax2 = fig.add_subplot(222)
ax2.plot(sod.x,sod.p)
ax2.axvline(x=sod.xcd, linestyle=':', linewidth=1, color='k')
ax2.axvline(x=sod.xsh, linestyle=':', linewidth=1, color='k')
ax2.set_xlabel('time')
ax2.set_ylabel('pressure')

# velocity plot
ax3 = fig.add_subplot(223)
ax3.plot(sod.x,sod.v)
ax3.axvline(x=sod.xcd, linestyle=':', linewidth=1, color='k')
ax3.axvline(x=sod.xsh, linestyle=':', linewidth=1, color='k')
ax3.set_xlabel('time')
ax3.set_ylabel('velocity')

# internal energy plot
ax4 = fig.add_subplot(224)
ax4.plot(sod.x,sod.e)
ax4.axvline(x=sod.xcd, linestyle=':', linewidth=1, color='k')
ax4.axvline(x=sod.xsh, linestyle=':', linewidth=1, color='k')
ax4.set_xlabel('time')
ax4.set_ylabel('internal E')

plt.annotate('time=%5.3f'%sod.time,(0.82,0.94),xycoords='figure fraction',fontsize='small')

# adjust margin
axset.subplots_adjust(fig)
