pyds.img2data
NOTE that magic function should be set to the one that allows interactive plotting such as ‘%matplotlib notebook’
First, you should click four boundary points. –> click first two points for setting minimum x & maximum x and next two points for setting minimum y & maximum y.
Second, now you can click data points repeatedly.
Third, when you fininshed clicking all data point, then you should finalize it with clicking ‘Stop Interaction’ Mark.
All data points will be saved in self.xdata & self.ydata in the type of ‘list’.
Linear scale plot
[1]:
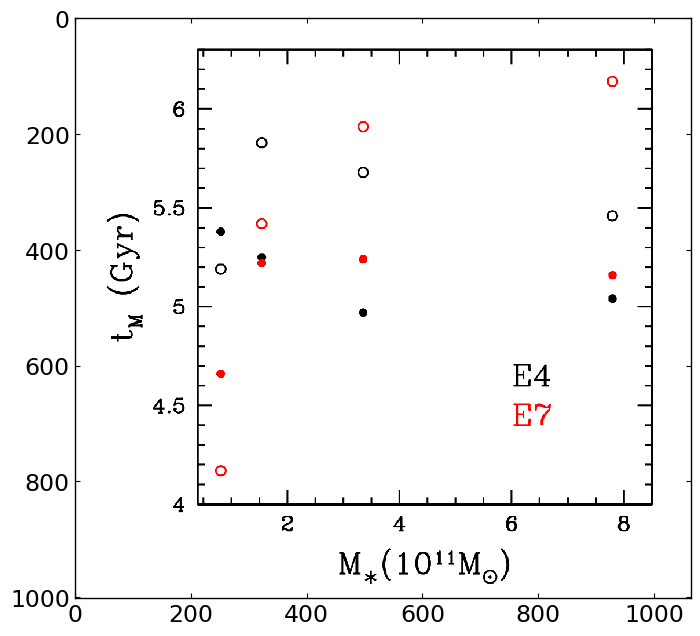
""" Let's prepare the figure in any readable format (e.g. png, jpg ..),
    and check the figure
    This is not interactive mode yet.
"""
import matplotlib.image as mpimg
import matplotlib.pyplot as plt
#import os
%matplotlib inline

#pyfig = os.environ['PYTHONDATA']
pyfig = './example_data/'
img = mpimg.imread(pyfig+'testlinear.png')

## note that img.shape[0] represents y-axis size
fig, ax = plt.subplots(figsize=(8,8.*img.shape[0]/img.shape[1]))

imgplot = ax.imshow(img)

[3]:
""" Now, it is interactive mode and you can collect all data point by clicking mouse.
    Sometimes, transitioning from '%matplotlib inline' to '%matplotlib notebook'
    seems not work smoothly.
    In this case, please just re-run this one (or two) more time, then it would work.
"""

from pyds.img2data import readimg
import matplotlib.pyplot as plt
import matplotlib.image as mpimg
#import os

# !!!!! important !!!!!
%matplotlib notebook

#pyfig = os.environ['PYTHONDATA']
pyfig = './example_data/'
img = mpimg.imread(pyfig+'testlinear.png')

fig, ax = plt.subplots(figsize=(8,8.*img.shape[0]/img.shape[1]))

imgplot = ax.imshow(img)

# x/y range in the plot accorindg to the position you set for boundary
xlim = [2.,6.]
ylim = [4.5,6.]

data = readimg(imgplot,ax,xlim=xlim,ylim=ylim)
[ ]:
""" If the lines overlapped on the figure bother you, you can collect
    the data point without lines.
"""

from pyds.img2data import readimg
import matplotlib.pyplot as plt
import matplotlib.image as mpimg
#import os

# !!!!! important !!!!!
%matplotlib notebook

#pyfig = os.environ['PYTHONDATA']
pyfig = './example_data/'
img = mpimg.imread(pyfig+'testlinear.png')

fig, ax = plt.subplots(figsize=(8,8.*img.shape[0]/img.shape[1]))

imgplot = ax.imshow(img)

# x/y range in the plot accorindg to the position you set for boundary
xlim = [2.,6.]
ylim = [4.5,6.]

data = readimg(imgplot,ax,xlim=xlim,ylim=ylim, noline=True)
[4]:
""" printing the data points you collected """

print(data.xdata,data.ydata)
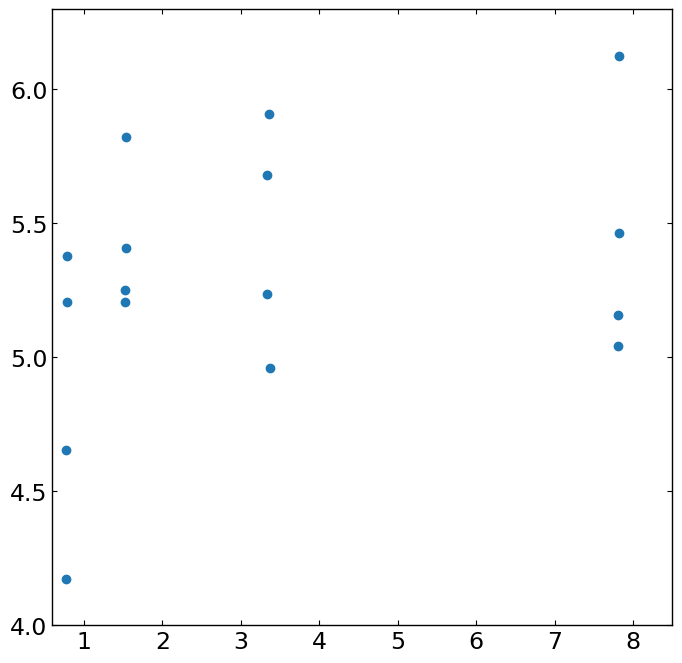
[0.7857142857142849, 0.7857142857142849, 0.7678571428571426, 0.7678571428571426, 1.5357142857142854, 1.5357142857142854, 1.5178571428571423, 1.5178571428571423, 3.357142857142857, 3.3392857142857144, 3.3392857142857144, 3.375, 7.821428571428572, 7.821428571428572, 7.803571428571429, 7.803571428571429] [5.377926421404682, 5.207357859531773, 4.655518394648829, 4.173913043478261, 5.8244147157190636, 5.408026755852843, 5.252508361204013, 5.207357859531773, 5.909698996655519, 5.678929765886288, 5.237458193979933, 4.961538461538462, 6.125418060200669, 5.463210702341137, 5.157190635451505, 5.04180602006689]
[5]:
""" check the data points with plot """
import matplotlib.pyplot as plt
%matplotlib inline

fig,ax = plt.subplots(figsize=(8,8))

ax.plot(data.xdata,data.ydata,'o')

ax.set_xlim([0.6,8.5])
ax.set_ylim([4.,6.3])
[5]:
(4.0, 6.3)

Log scale plot
[6]:
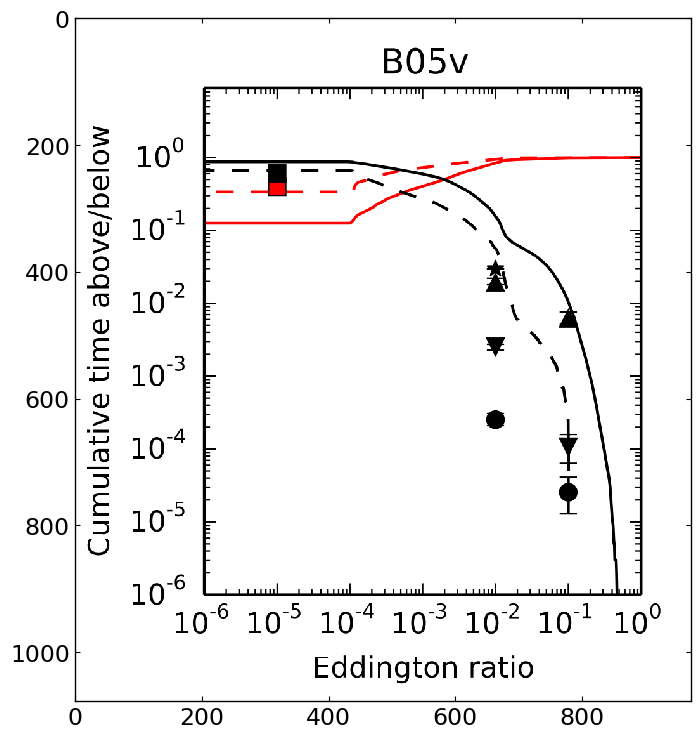
""" Let's prepare the figure in any readable format (e.g. png, jpg ..),
    and check the figure. This is not interactive mode yet.
    This example is for the figure in logarithmic scale. """

import matplotlib.image as mpimg
import matplotlib.pyplot as plt
#import os
%matplotlib inline

#pyfig = os.environ['PYTHONDATA']
pyfig = './example_data/'
img = mpimg.imread(pyfig+'testlog.png')

fig, ax = plt.subplots(figsize=(8,8.*img.shape[0]/img.shape[1]))
imgplot = ax.imshow(img)

[8]:
""" Now, it is interactive mode and you can collect all data point by clicking mouse.
    Sometimes, transitioning from '%matplotlib inline' to '%matplotlib notebook'
    seems not work smoothly. In this case, please just run this one (or two) more time,
    then it would work.
"""

from pyds.img2data import readimg
import matplotlib.pyplot as plt
import matplotlib.image as mpimg
#import os
# !!!!! important !!!!!
%matplotlib notebook

#pyfig = os.environ['PYTHONDATA']
pyfig = './example_data/'
img = mpimg.imread(pyfig+'testlog.png')

fig, ax = plt.subplots(figsize=(8,8.*img.shape[0]/img.shape[1]))
imgplot = ax.imshow(img)

# x/y range in the plot accorindg to the position you set for boundary
xlim = [1e-6,1.]
ylim = [1e-6,1.]

data = readimg(imgplot,ax,xlim=xlim,ylim=ylim,xlog=True,ylog=True)
[9]:
""" printing the data points you collected """

print(data.xdata,data.ydata)
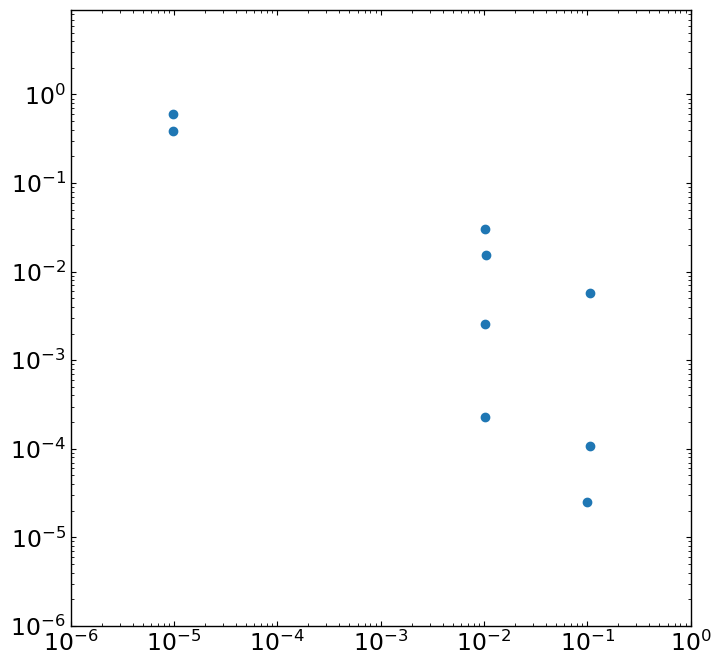
[9.739986443321014e-06, 9.739986443321014e-06, 0.010212999674771751, 0.010541035967159761, 0.010212999674771751, 0.010212999674771751, 0.10596724043239221, 0.10596724043239221, 0.09947447837791917] [0.6037010313703743, 0.3881870971495878, 0.03016143878784795, 0.015551805709238663, 0.002576077379549393, 0.00022707241745534802, 0.0056679323432112455, 0.0001065116862401254, 2.496090193044159e-05]
[10]:
""" check the data points with plot """

import matplotlib.pyplot as plt
%matplotlib inline

fig,ax = plt.subplots(figsize=(8,8))

ax.loglog(data.xdata,data.ydata,'o')
ax.set_xlim([1e-6,1])
ax.set_ylim([1e-6,9.])
[10]:
(1e-06, 9.0)
